> ## Documentation Index
> Fetch the complete documentation index at: https://docs.attensira.com/llms.txt
> Use this file to discover all available pages before exploring further.
# Prompt Volumes
> Discover how often specific questions are asked across AI platforms like ChatGPT, Claude, and Perplexity. Use volume data to prioritize which prompts to track and optimize.
Prompt Volumes help you understand how often specific types of questions are being asked across AI platforms. This data helps you prioritize which prompts to track and optimize for.
 ## Searching for prompts
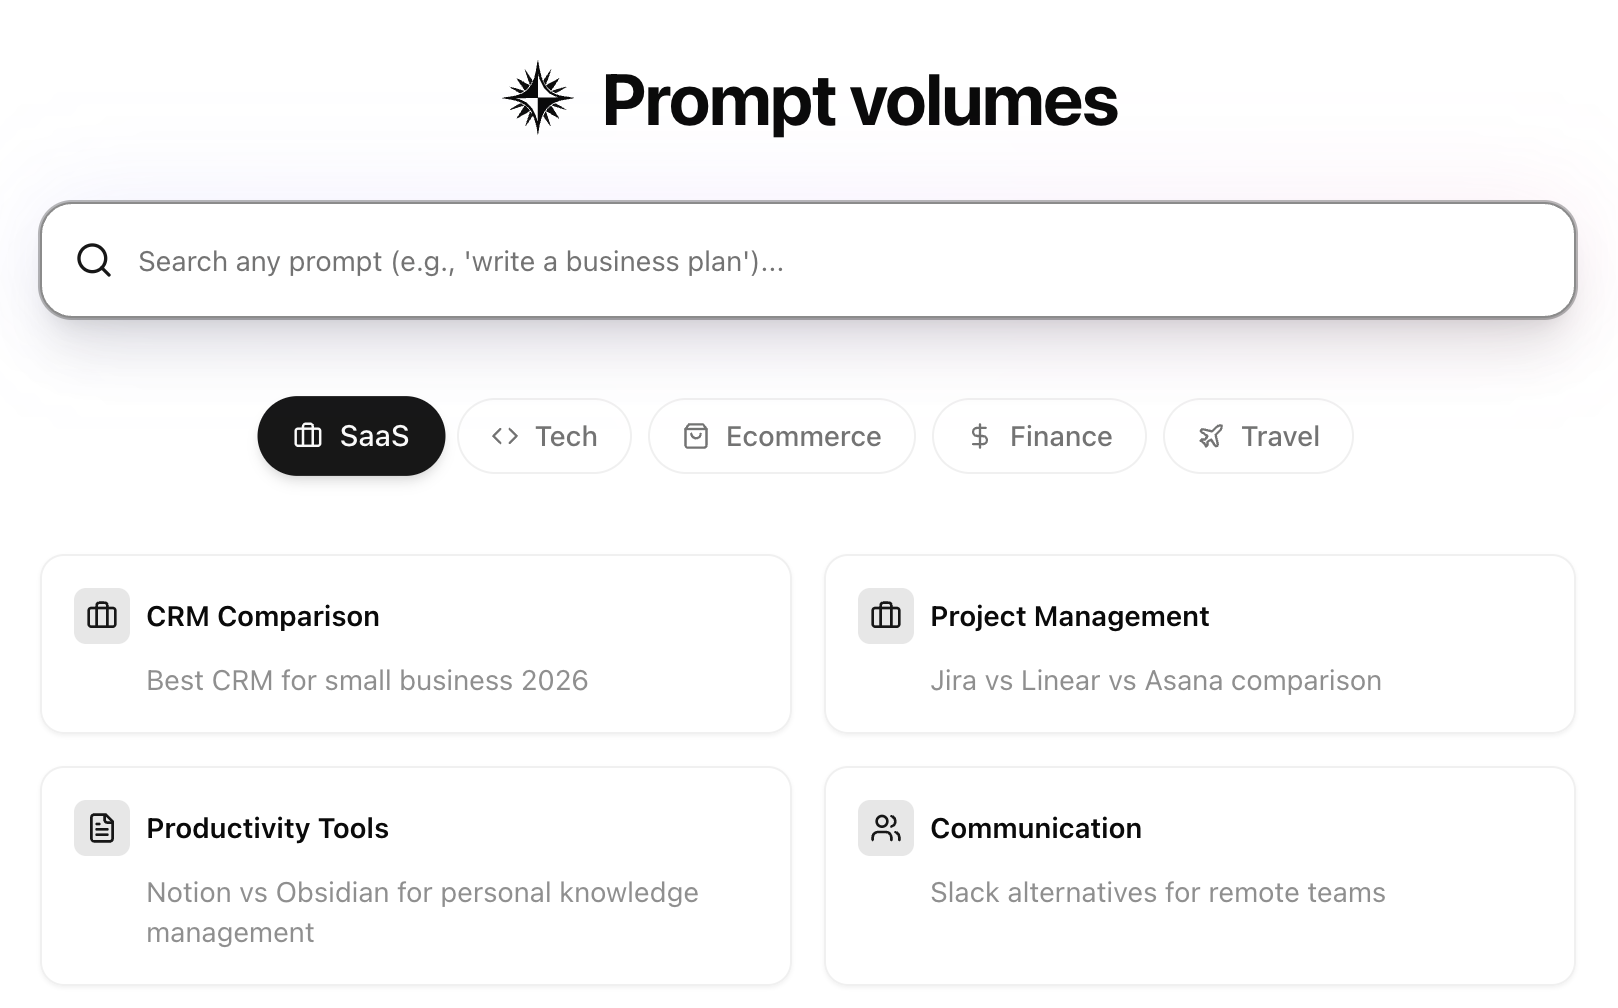
Use the search bar to look up any prompt and see its volume across AI platforms. You can search for specific queries like "write a business plan" or browse by category.
### Categories
Browse prompts by industry category:
* **SaaS** — Software and business tool comparisons
* **Tech** — Technology and development topics
* **Ecommerce** — Shopping and product queries
* **Finance** — Financial planning and investment questions
* **Travel** — Travel planning and destination queries
Each category shows popular prompt examples to help you discover relevant queries for your industry.
## Understanding the details page
When you select a prompt, you'll see detailed volume data and trends.
## Searching for prompts
Use the search bar to look up any prompt and see its volume across AI platforms. You can search for specific queries like "write a business plan" or browse by category.
### Categories
Browse prompts by industry category:
* **SaaS** — Software and business tool comparisons
* **Tech** — Technology and development topics
* **Ecommerce** — Shopping and product queries
* **Finance** — Financial planning and investment questions
* **Travel** — Travel planning and destination queries
Each category shows popular prompt examples to help you discover relevant queries for your industry.
## Understanding the details page
When you select a prompt, you'll see detailed volume data and trends.
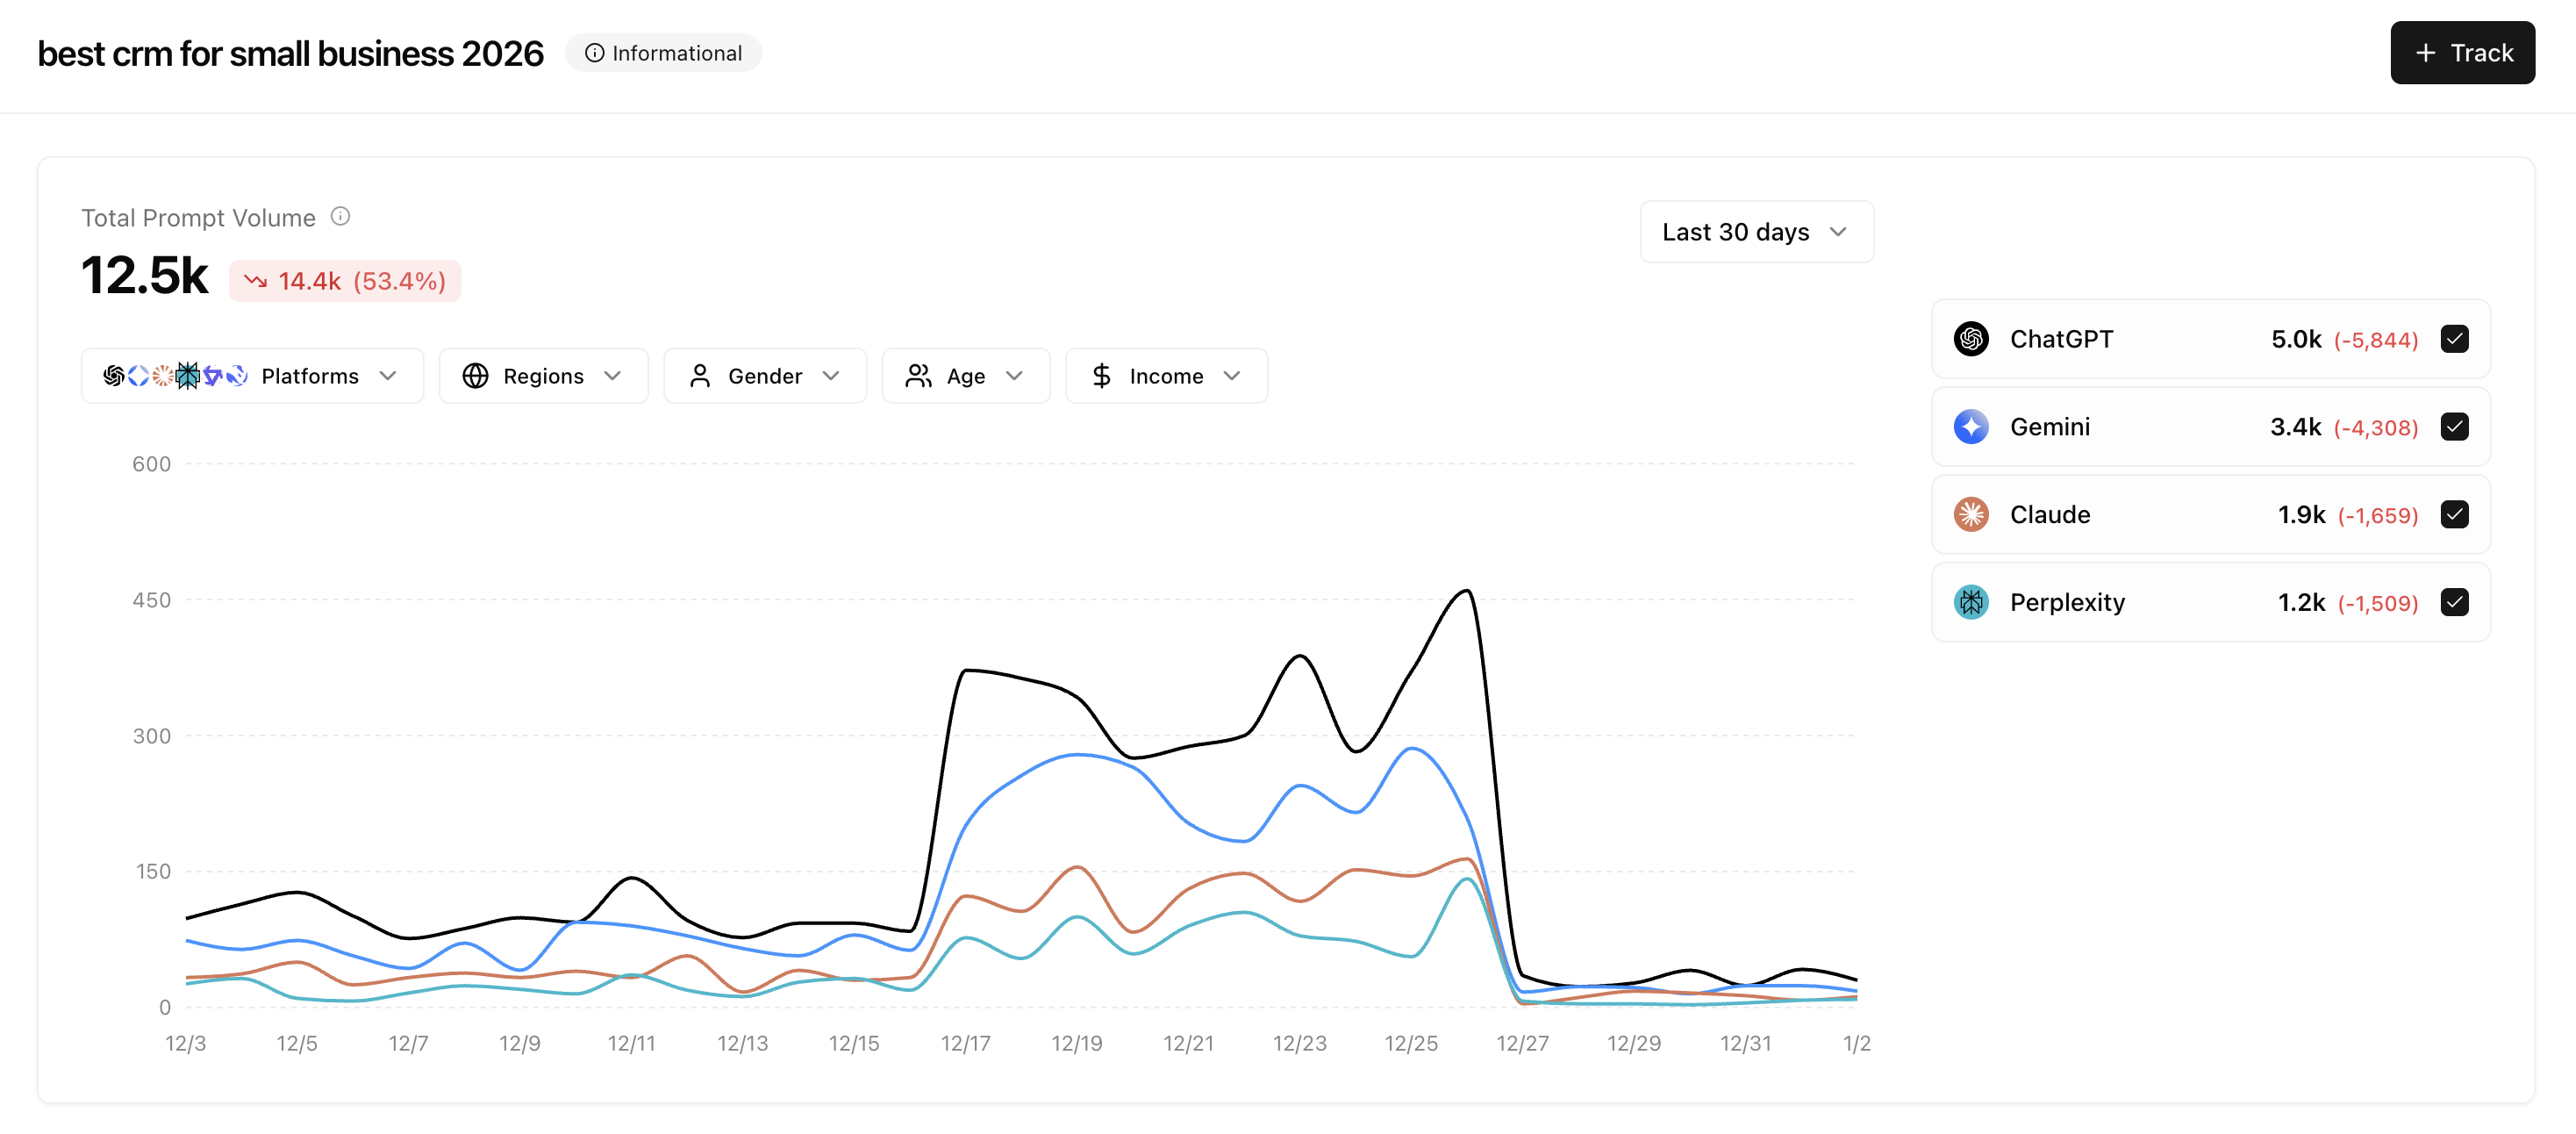 The details page shows:
* **Total Prompt Volume** — The aggregate number of prompts across all platforms
* **Change indicator** — How volume has changed compared to the previous period
* **Platform breakdown** — Individual volumes for ChatGPT, Gemini, Claude, Perplexity, Copilot, and other platforms
## Filtering your data
Use the filter bar to narrow down prompt volume data to specific segments.
### Platforms
Filter by specific AI platforms to see where users are asking questions.
The details page shows:
* **Total Prompt Volume** — The aggregate number of prompts across all platforms
* **Change indicator** — How volume has changed compared to the previous period
* **Platform breakdown** — Individual volumes for ChatGPT, Gemini, Claude, Perplexity, Copilot, and other platforms
## Filtering your data
Use the filter bar to narrow down prompt volume data to specific segments.
### Platforms
Filter by specific AI platforms to see where users are asking questions.
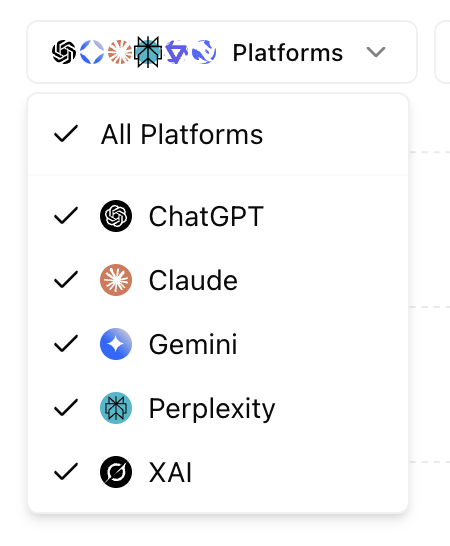 Available platforms include ChatGPT, Claude, Gemini, Perplexity, Copilot, Grok, DeepSeek, Qwen, Google AI Mode, and Google AI Overview.
### Regions
Filter by geographic region to understand regional search behavior.
Available platforms include ChatGPT, Claude, Gemini, Perplexity, Copilot, Grok, DeepSeek, Qwen, Google AI Mode, and Google AI Overview.
### Regions
Filter by geographic region to understand regional search behavior.
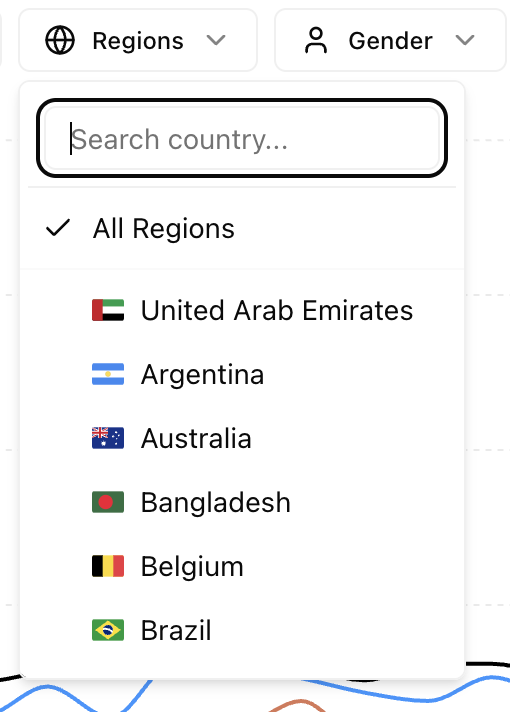 Search for specific countries or select "All Regions" to see global data.
### Demographics
Filter by demographic segments to understand your audience better:
All Genders, Female, Male, Other
18-24, 25-34, 35-44, 45-54, 55-64, 65+
$0-25k, $25k-50k, \$50k-75k, and more
## Reading the chart
The volume chart visualizes prompt trends over your selected time period.
### Understanding the lines
Each colored line represents a different AI platform:
* **Black line** — Typically represents ChatGPT (highest volume)
* **Blue line** — Gemini
* **Orange line** — Claude
* **Teal line** — Perplexity
### Analyzing trends
When reading the chart, look for:
* **Spikes** — Sudden increases may indicate trending topics or seasonal interest
* **Dips** — Decreases around holidays or events (e.g., the drop around Dec 25-27)
* **Platform divergence** — When one platform trends differently, it may indicate platform-specific behavior
* **Overall trajectory** — Is volume growing, stable, or declining over time?
The legend on the right shows exact volumes for each platform along with the change from the previous period.
## Next steps
Understand where AI models get their information
Track brand and competitor mentions
Search for specific countries or select "All Regions" to see global data.
### Demographics
Filter by demographic segments to understand your audience better:
All Genders, Female, Male, Other
18-24, 25-34, 35-44, 45-54, 55-64, 65+
$0-25k, $25k-50k, \$50k-75k, and more
## Reading the chart
The volume chart visualizes prompt trends over your selected time period.
### Understanding the lines
Each colored line represents a different AI platform:
* **Black line** — Typically represents ChatGPT (highest volume)
* **Blue line** — Gemini
* **Orange line** — Claude
* **Teal line** — Perplexity
### Analyzing trends
When reading the chart, look for:
* **Spikes** — Sudden increases may indicate trending topics or seasonal interest
* **Dips** — Decreases around holidays or events (e.g., the drop around Dec 25-27)
* **Platform divergence** — When one platform trends differently, it may indicate platform-specific behavior
* **Overall trajectory** — Is volume growing, stable, or declining over time?
The legend on the right shows exact volumes for each platform along with the change from the previous period.
## Next steps
Understand where AI models get their information
Track brand and competitor mentions