> ## Documentation Index
> Fetch the complete documentation index at: https://docs.attensira.com/llms.txt
> Use this file to discover all available pages before exploring further.
# Results
> Analyze how AI models respond to your tracked prompts. View performance metrics, source citations, individual responses, and AI-powered improvement recommendations.
The prompt results page shows you exactly how AI models respond to a specific prompt. Here you'll see your performance metrics, which sources are being cited, and every individual response.
## Header
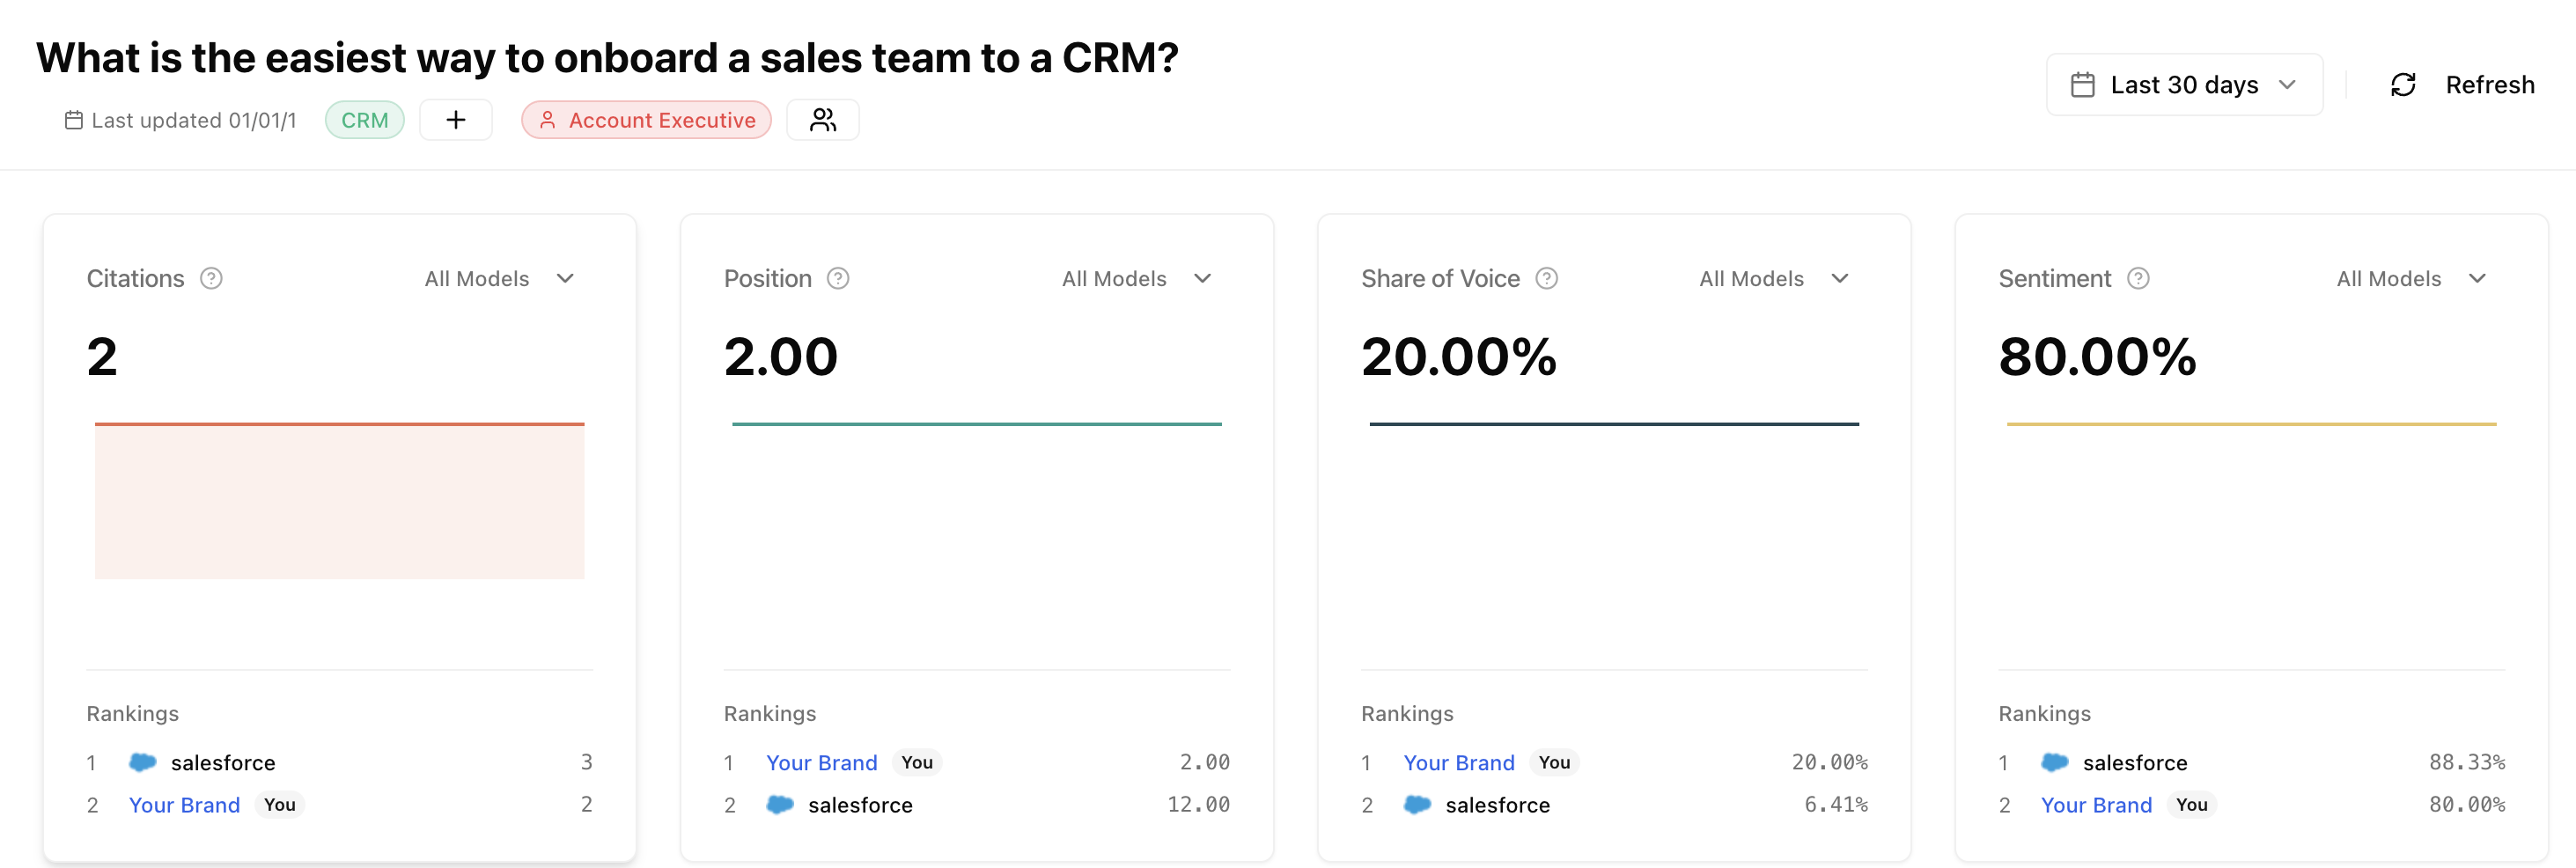
At the top of the prompt results page, you'll find key information and actions.
 ### Last updated
See when data was last collected for this prompt. Click **Refresh** to manually trigger a new run and get fresh results.
### Quick actions
Organize and navigate without leaving the page:
* **Add tags** - Group this prompt with tags like "Competitor Comparison", "Feature Query", or "Pricing"
* **Attach personas** - Assign personas (e.g., "Enterprise Buyer", "SMB Owner") to segment your analysis
* **View prompt** - Jump to the prompt configuration page
### Core metrics
The header displays your four key performance indicators:
How often your pages are cited as sources
Your percentage of the AI response
Your typical ranking when mentioned
How positively AI describes your brand
Each metric shows:
* Current value
* Trend direction (up/down arrow)
* Change from previous period
## Improvements
If you have enabled improvements for this prompt, you will see recommended actions to boost your visibility.
### Last updated
See when data was last collected for this prompt. Click **Refresh** to manually trigger a new run and get fresh results.
### Quick actions
Organize and navigate without leaving the page:
* **Add tags** - Group this prompt with tags like "Competitor Comparison", "Feature Query", or "Pricing"
* **Attach personas** - Assign personas (e.g., "Enterprise Buyer", "SMB Owner") to segment your analysis
* **View prompt** - Jump to the prompt configuration page
### Core metrics
The header displays your four key performance indicators:
How often your pages are cited as sources
Your percentage of the AI response
Your typical ranking when mentioned
How positively AI describes your brand
Each metric shows:
* Current value
* Trend direction (up/down arrow)
* Change from previous period
## Improvements
If you have enabled improvements for this prompt, you will see recommended actions to boost your visibility.
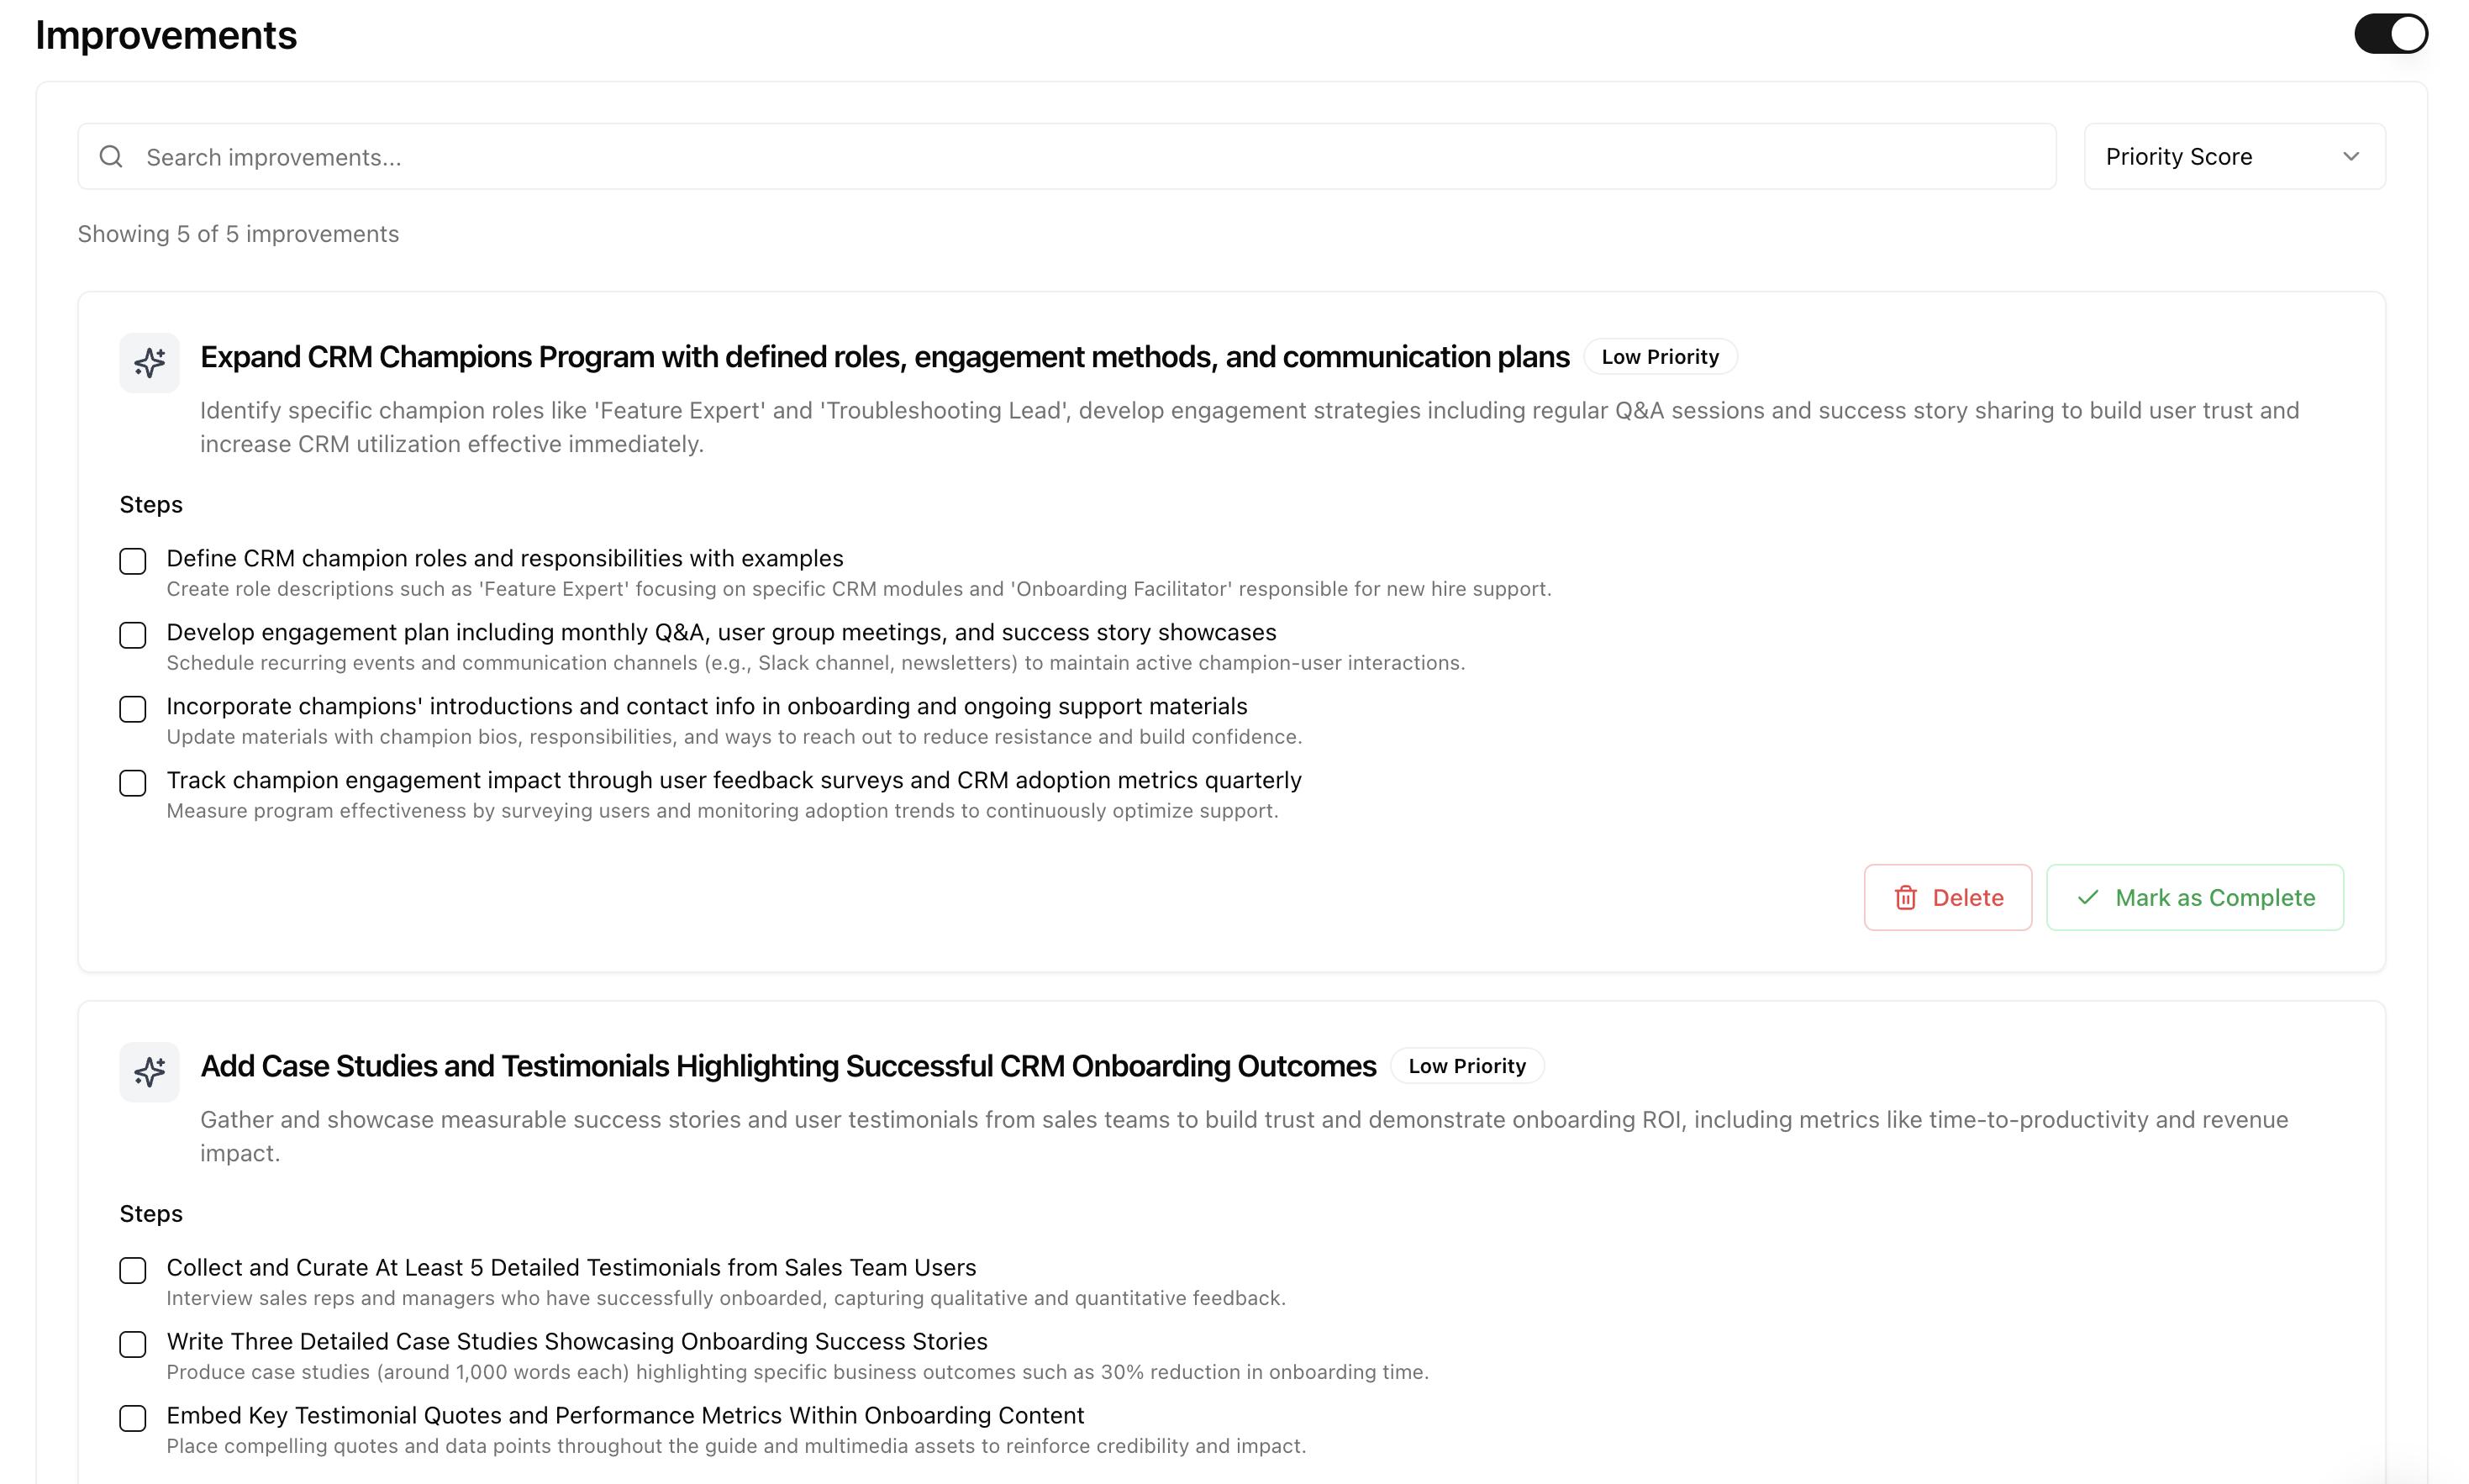 The improvements section shows:
| Recommendation | Description |
| --------------------- | ------------------------------------------------------------------------- |
| **Pages to optimize** | Specific pages on your site that could help you rank for this prompt |
| **Content gaps** | Topics you should cover that competitors are ranking for |
| **Similarity score** | How well each page matches the prompt (content relevance, not difficulty) |
The similarity score tells you how well a page content matches the prompt, not how difficult it is to rank.
* High similarity (70%+): Content already relevant. Focus optimization here first.
* Medium similarity (40-70%): Partially relevant. May need expansion.
* Low similarity (below 40%): Different topic. Consider creating new content instead.
Example for "best CRM for sales teams":
* /solutions/sales-crm at 89% directly addresses the query
* /features/reporting at 45% related but not specific enough
* /blog/marketing-tips at 12% wrong topic entirely
Enable improvements in your prompt settings to get AI-powered recommendations for this prompt.
## Sources
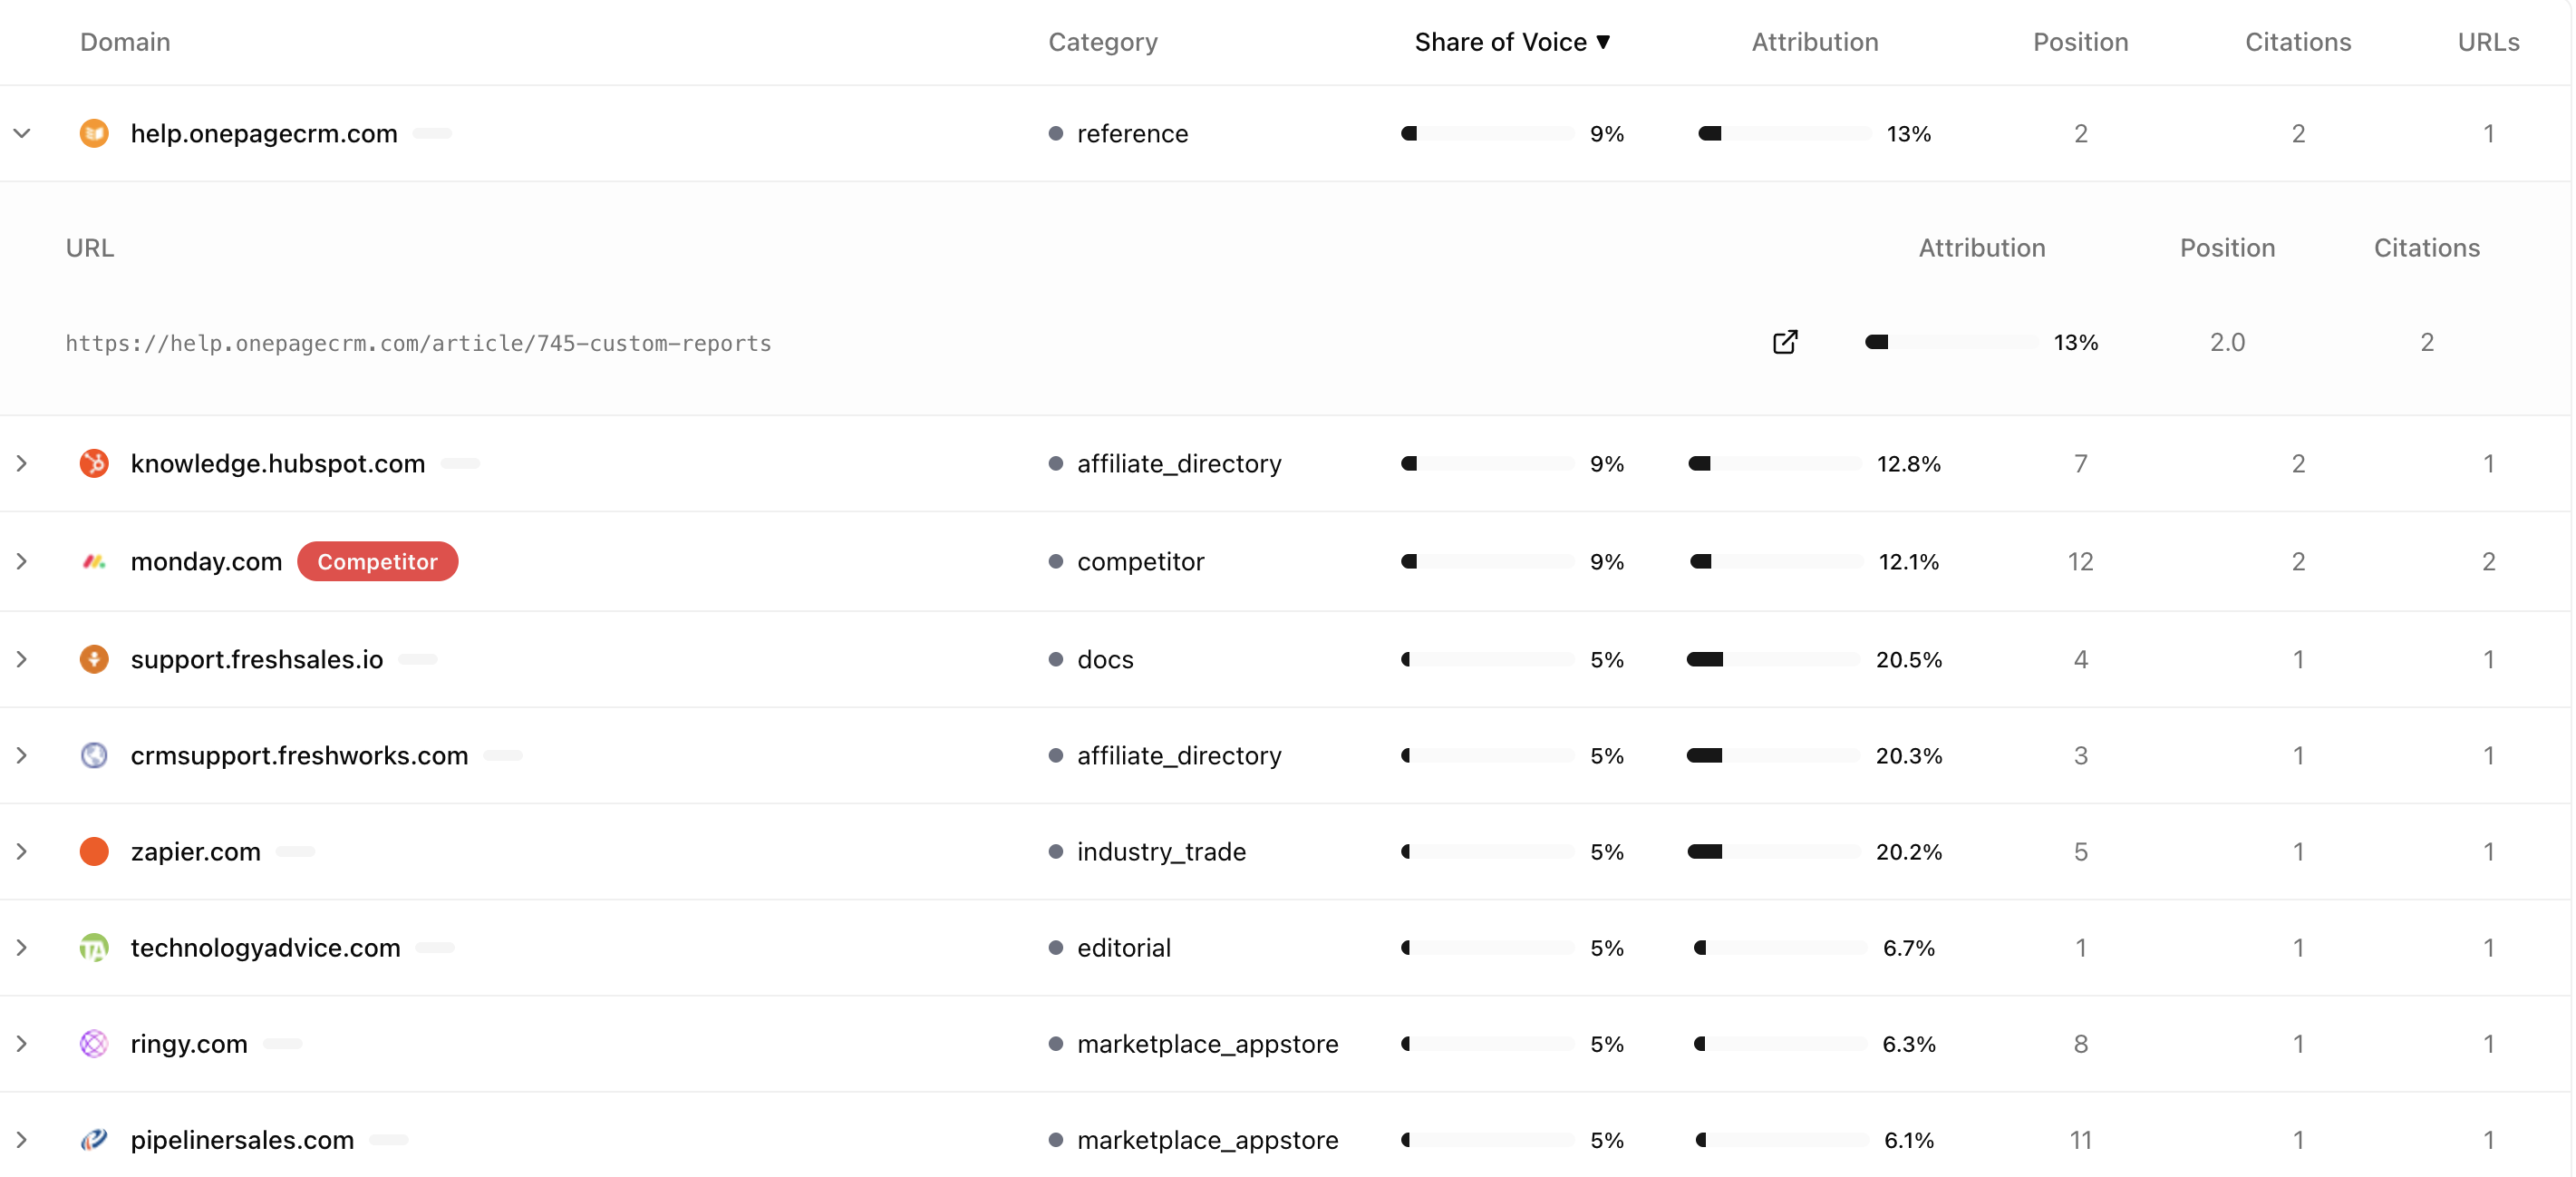
The sources section shows which websites AI models cited when answering this prompt.
The improvements section shows:
| Recommendation | Description |
| --------------------- | ------------------------------------------------------------------------- |
| **Pages to optimize** | Specific pages on your site that could help you rank for this prompt |
| **Content gaps** | Topics you should cover that competitors are ranking for |
| **Similarity score** | How well each page matches the prompt (content relevance, not difficulty) |
The similarity score tells you how well a page content matches the prompt, not how difficult it is to rank.
* High similarity (70%+): Content already relevant. Focus optimization here first.
* Medium similarity (40-70%): Partially relevant. May need expansion.
* Low similarity (below 40%): Different topic. Consider creating new content instead.
Example for "best CRM for sales teams":
* /solutions/sales-crm at 89% directly addresses the query
* /features/reporting at 45% related but not specific enough
* /blog/marketing-tips at 12% wrong topic entirely
Enable improvements in your prompt settings to get AI-powered recommendations for this prompt.
## Sources
The sources section shows which websites AI models cited when answering this prompt.
 ### Source table
Sources are grouped by domain with these columns:
| Column | Description |
| ------------------ | -------------------------------------------------------------- |
| **Domain** | The source website (e.g., g2.com, wikipedia.org) |
| **Category** | Type of source (competitor, review site, publication, etc.) |
| **Share of Voice** | What percentage of the answer meaning came from this source |
| **Attribution** | How the source was used (direct quote, paraphrase, background) |
| **Position** | Where this source ranks among all sources |
| **Citations** | How many times this source was cited |
| **URLs** | Number of specific pages cited from this domain |
### Understanding source attribution
Share of Voice for sources shows where the answer meaning comes from, not just which links appeared.
| Source | Share of Voice |
| ---------------- | -------------- |
| wikipedia.org | 68% |
| g2.com | 18% |
| your-company.com | 8% |
| techcrunch.com | 6% |
In this example, even though Wikipedia has just one link, 68% of the actual meaning came from Wikipedia. Authoritative sources often shape the answer even when not prominently displayed.
### What to look for
| Pattern | What it means | Action |
| ---------------------- | ------------------------------ | ---------------------------- |
| Competitor dominates | Their content shapes answers | Create competitive content |
| Wikipedia high | Generic info dominates | Add unique, specific details |
| Review sites prominent | Third-party validation matters | Improve review presence |
| Your site low | Your content is not used | Optimize pages for AI |
## Responses
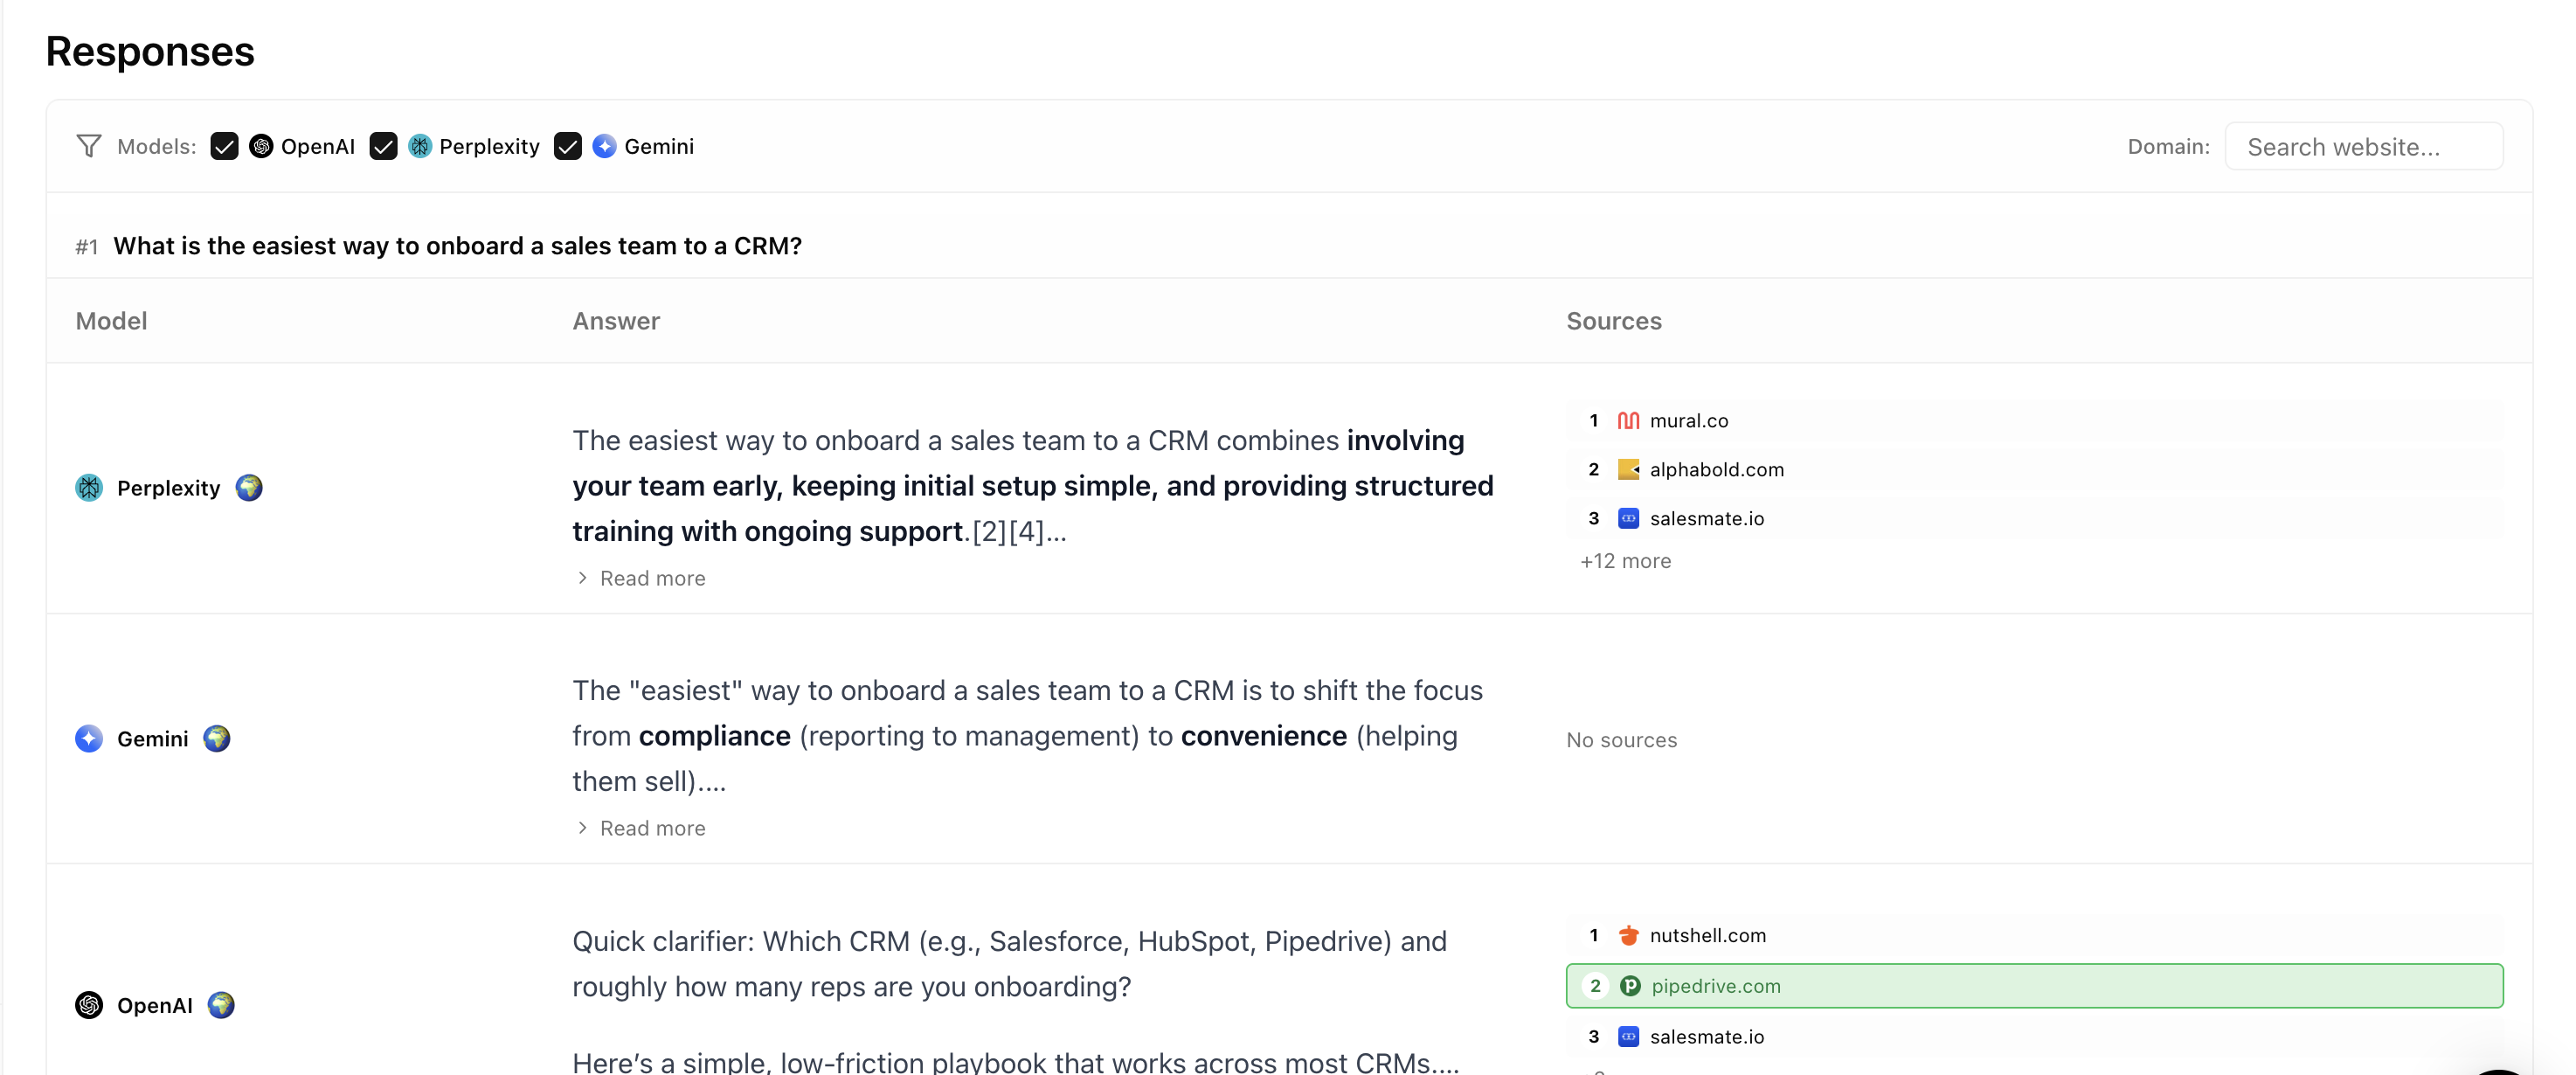
Below sources, you will find every individual AI response for this prompt.
### Source table
Sources are grouped by domain with these columns:
| Column | Description |
| ------------------ | -------------------------------------------------------------- |
| **Domain** | The source website (e.g., g2.com, wikipedia.org) |
| **Category** | Type of source (competitor, review site, publication, etc.) |
| **Share of Voice** | What percentage of the answer meaning came from this source |
| **Attribution** | How the source was used (direct quote, paraphrase, background) |
| **Position** | Where this source ranks among all sources |
| **Citations** | How many times this source was cited |
| **URLs** | Number of specific pages cited from this domain |
### Understanding source attribution
Share of Voice for sources shows where the answer meaning comes from, not just which links appeared.
| Source | Share of Voice |
| ---------------- | -------------- |
| wikipedia.org | 68% |
| g2.com | 18% |
| your-company.com | 8% |
| techcrunch.com | 6% |
In this example, even though Wikipedia has just one link, 68% of the actual meaning came from Wikipedia. Authoritative sources often shape the answer even when not prominently displayed.
### What to look for
| Pattern | What it means | Action |
| ---------------------- | ------------------------------ | ---------------------------- |
| Competitor dominates | Their content shapes answers | Create competitive content |
| Wikipedia high | Generic info dominates | Add unique, specific details |
| Review sites prominent | Third-party validation matters | Improve review presence |
| Your site low | Your content is not used | Optimize pages for AI |
## Responses
Below sources, you will find every individual AI response for this prompt.
 ### Understanding the table
Each row is one response from one AI model:
| Column | Description |
| ------------- | -------------------------------------------- |
| **Platform** | Which AI model (ChatGPT, Claude, Perplexity) |
| **Country** | Geographic setting for the query |
| **Persona** | Which persona was used, if any |
| **Position** | Where you ranked (1st, 2nd, not mentioned) |
| **Mentioned** | Whether your brand appeared |
| **Sentiment** | How you were described |
| **Date** | When captured |
One prompt in Attensira creates multiple responses. If you track 2 countries and 3 AI models, that is 6 individual responses per run.
### Response detail
Click any row to see the full response:
### Understanding the table
Each row is one response from one AI model:
| Column | Description |
| ------------- | -------------------------------------------- |
| **Platform** | Which AI model (ChatGPT, Claude, Perplexity) |
| **Country** | Geographic setting for the query |
| **Persona** | Which persona was used, if any |
| **Position** | Where you ranked (1st, 2nd, not mentioned) |
| **Mentioned** | Whether your brand appeared |
| **Sentiment** | How you were described |
| **Date** | When captured |
One prompt in Attensira creates multiple responses. If you track 2 countries and 3 AI models, that is 6 individual responses per run.
### Response detail
Click any row to see the full response:
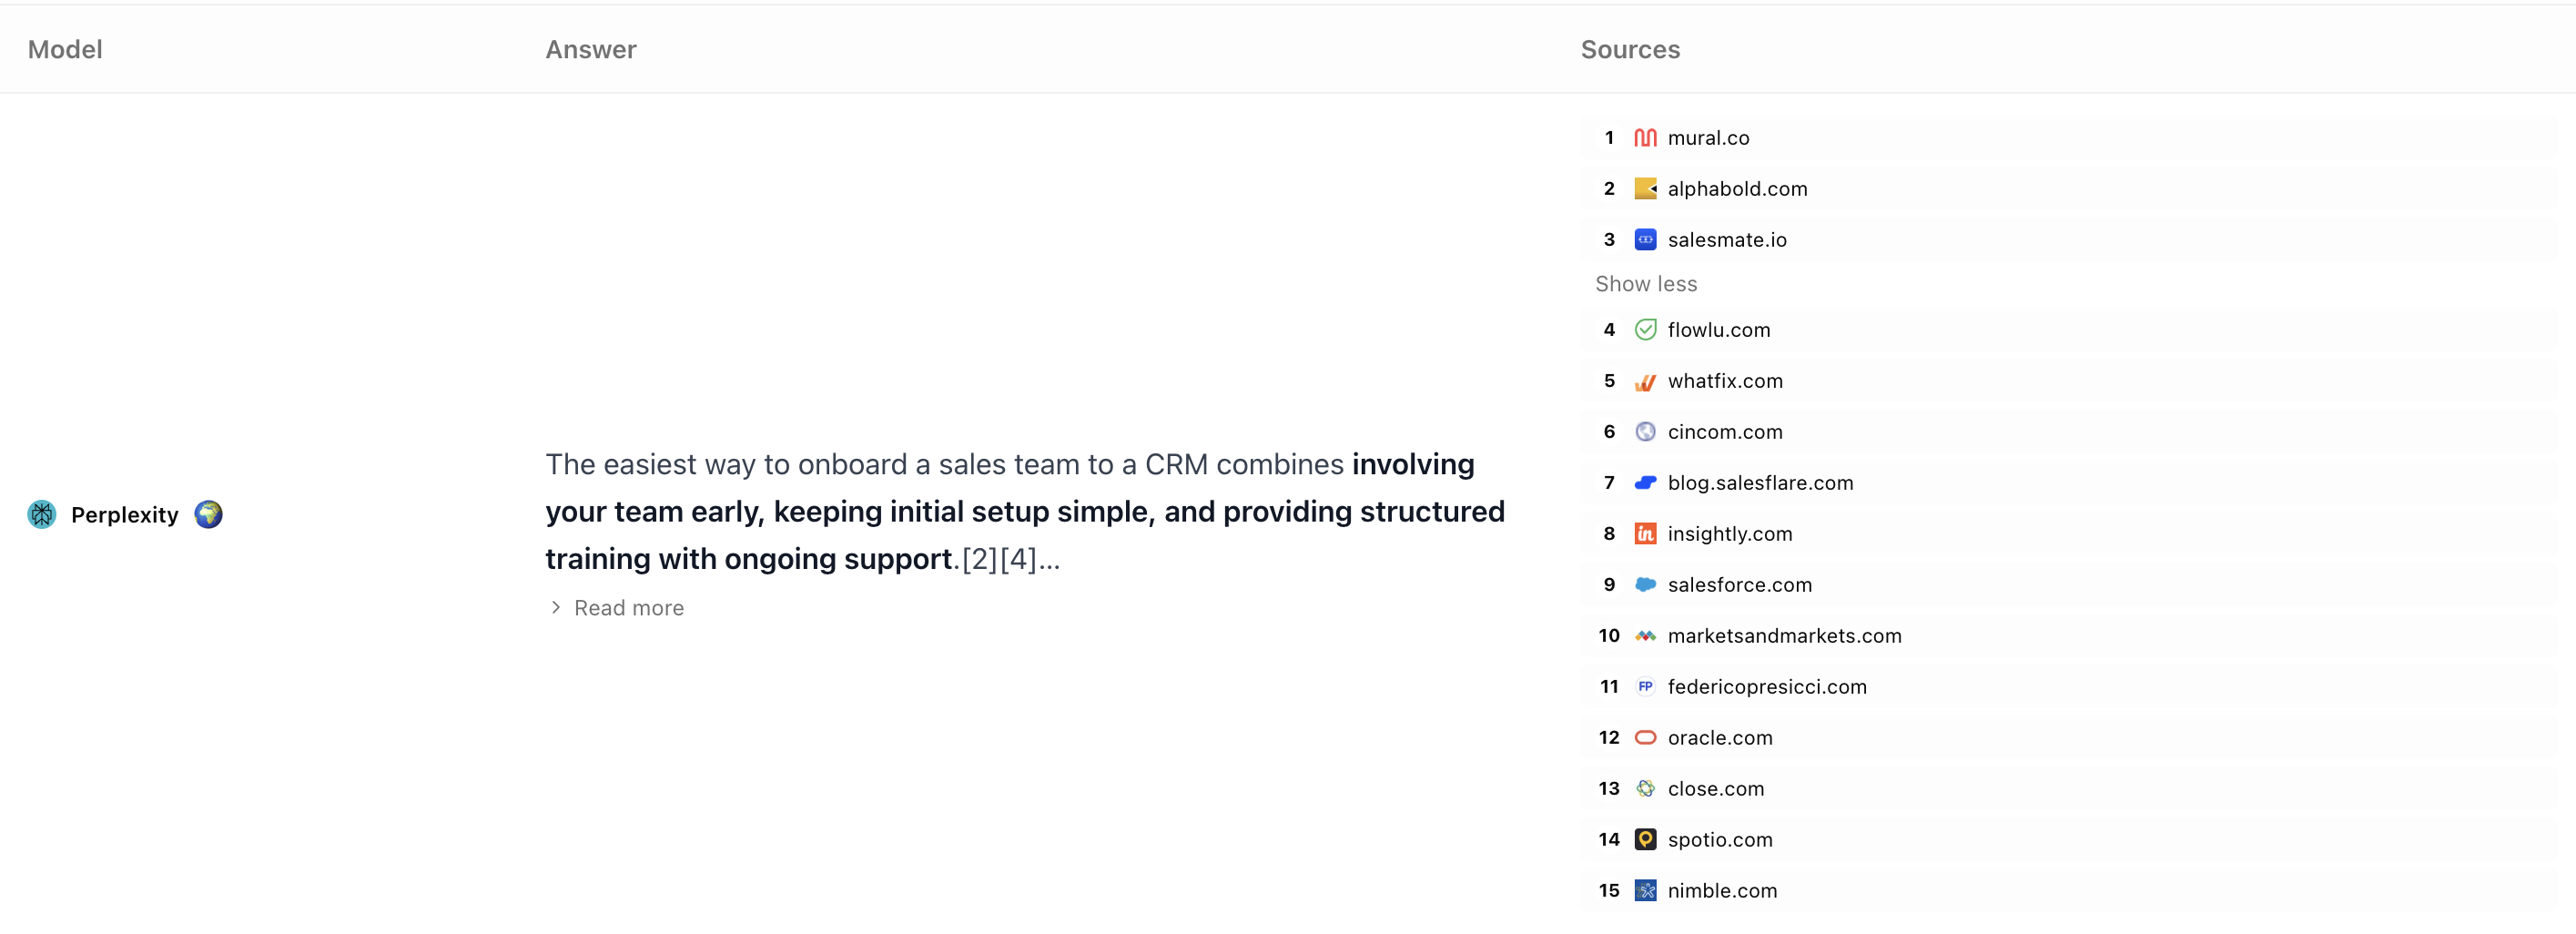 The detail view shows:
* Full AI response with your brand highlighted
* Sources cited in this specific response
* Competitor mentions and how they were described
* Sentiment breakdown
### Filtering responses
Use filters to find patterns:
| Filter | Use case |
| ---------------- | ----------------------------------------- |
| **By Platform** | Compare ChatGPT vs Claude vs Perplexity |
| **By Country** | See geographic differences |
| **By Position** | Find where you win (Position = 1) or lose |
| **By Mentioned** | Focus on responses where you are missing |
### Finding patterns
Look across responses to answer:
* Why do I rank better on Claude? Filter by platform, compare attributes
* Why am I missing in the UK? Filter by country, check local competitors
* What makes me win? Filter Position = 1, analyze common factors
## Next steps
Learn strategies to improve your ranking
See performance from the page perspective
The detail view shows:
* Full AI response with your brand highlighted
* Sources cited in this specific response
* Competitor mentions and how they were described
* Sentiment breakdown
### Filtering responses
Use filters to find patterns:
| Filter | Use case |
| ---------------- | ----------------------------------------- |
| **By Platform** | Compare ChatGPT vs Claude vs Perplexity |
| **By Country** | See geographic differences |
| **By Position** | Find where you win (Position = 1) or lose |
| **By Mentioned** | Focus on responses where you are missing |
### Finding patterns
Look across responses to answer:
* Why do I rank better on Claude? Filter by platform, compare attributes
* Why am I missing in the UK? Filter by country, check local competitors
* What makes me win? Filter Position = 1, analyze common factors
## Next steps
Learn strategies to improve your ranking
See performance from the page perspective